Brooks Running Customer Care Center

Project manager and primary author, Brooks Running Customer Care Center, brooksrunning.com.
Key stats:
- Over 72,000 views monthly on average
- 94 total articles, as of June 2024
Brooks Running, 2024
Image: Brooks Running
In January 2024 as part of my role as a Senior Runner Experience Specialist at Brooks Running, I took over the management and maintenance of the Brooks Running Customer Care Center. The Customer Care Center is the main resource for customer FAQs and, when maintained effectively, increases the customer’s ability to self serve (and therefore decreases the number of contacts that reach our service team). The Center currently includes 94 articles across five sections – Gear advice; Orders, accounts, and payments; Shipping and delivery; Returns and exchanges; and This is Brooks.
When I took over the Center, there was no data analysis being conducted, and I quickly implemented key performance indicators (KPIs) to analyze the health of the Center. The data I pull enables me to make strategic decisions on what articles to improve or otherwise edit/delete, how to optimize search results, and determine what opportunities for new articles exist. I also currently serve as the primary author in the Center, and I must adhere to Brooks’ brand expression, including voice, tone, marketing platform usage, and style consistency (predominately AP style with minor changes).
Article drafting, editing, & publishing
As primary author of the Customer Care Center, I am responsible for writing new articles and editing current articles to ensure information is accurate, Brooks brand expression and style are consistent, and answers are clear and actionable. During my time as primary author, I have written or significantly edited the following articles, among others:
- How do I return an item I purchased on brooksrunning.com?
- How do I exchange an item I purchased on brooksrunning.com?
- How can I return or exchange an item I bought at a retail store?
- How can I exchange an item I received as a gift?
- All articles in the Shipping and delivery section
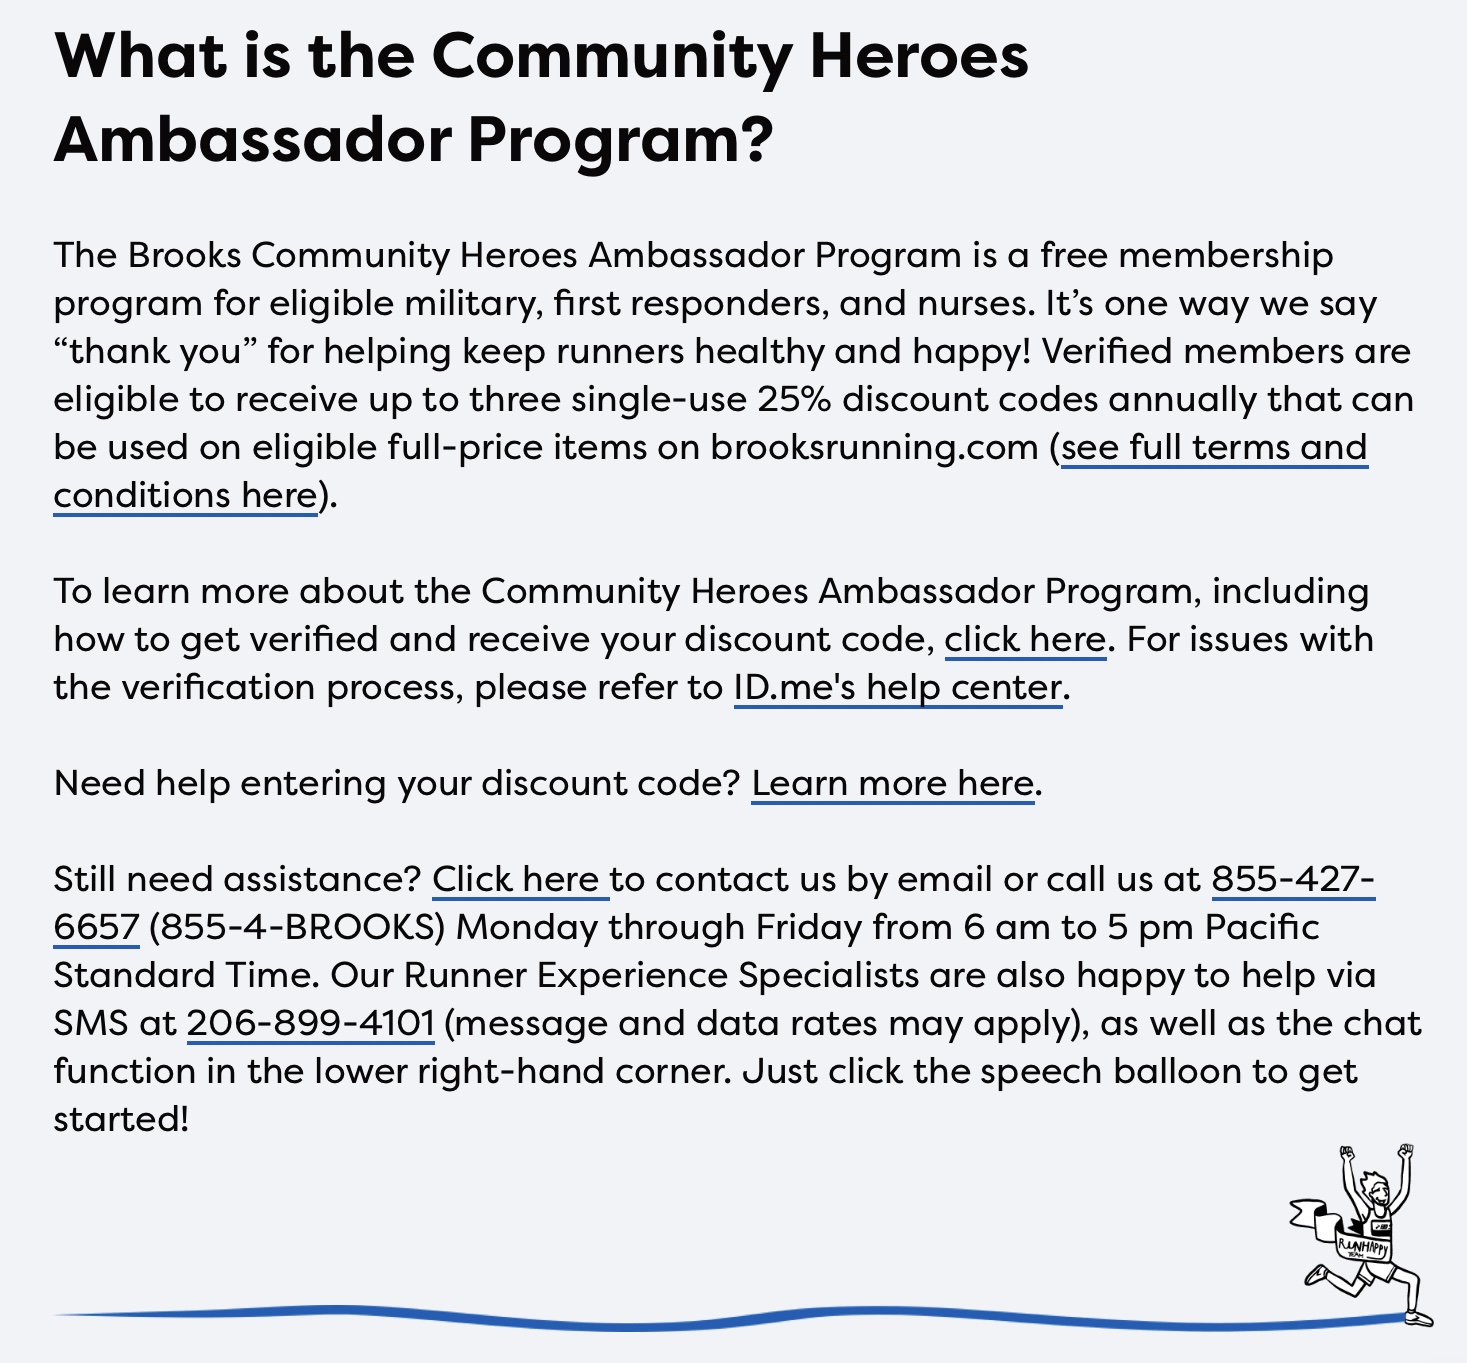
- What is the Community Heroes Ambassador Program?
- What is a GTS shoe?
- How do I edit the information in my account?
I send drafted articles to key stakeholders and other writers for critique, implement their feedback, and publish the articles once revised. Article additions, edits, and deletions are decided by KPIs, as discussed in the next section.
Data analysis & reporting
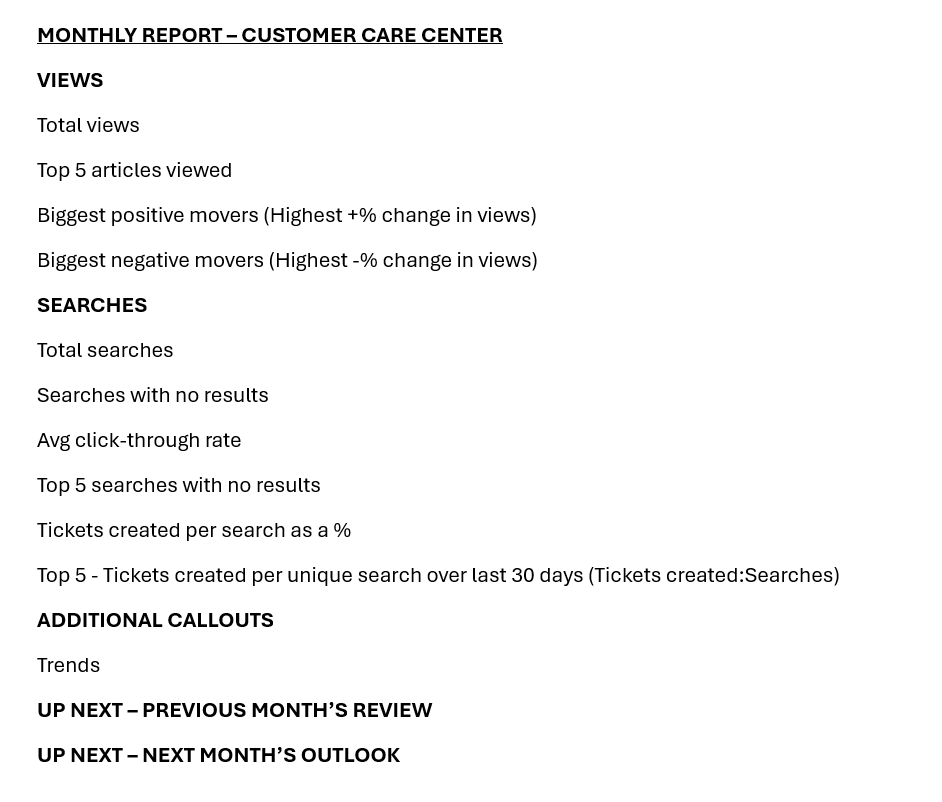
As project manager of the Customer Care Center, I also own its data analysis and reporting to key stakeholders. I report on several KPIs monthly, as outlined in the template featured below. Reporting focuses on views, searches, trends, and next steps, ensuring that I and my colleagues are aware of opportunities and threats relevant to the success of the Center.
Since taking over the Center in 2024, all KPIs have been positively impacted, with the only exception being the percentage of downvotes per view. When dissected, articles related to greater company policies, such as the ability to change or cancel an order once it is placed, receive the most downvotes. Therefore, company policies must be considered along with the effectiveness and clarity of the information presented in articles when it comes to voting.
I am most proud of the reduction of the percentage of tickets created per search. This KPI can be defined as the number of tickets created from the Customer Care Center divided by the number of searches within the Customer Care Center and is communicated as a percentage. In short, the lower this number, the more effective the Center, because it reflects that customers are able to self serve more frequently. Certain issues are not fully self serviceable and will require that a customer reaches out to our service team (i.e. creates a ticket), so while this number will (and should) never be zero, it is still important to keep it as low as possible.
Below is a comparison of KPIs from P1 – P6 2024 (January through June 2024, when I took over the Center) and that same timeframe in 2023:
Customer Care Center KPIs
| Timeframe | Views | Net Votes | % Upvotes per View | % Downvotes per View | Tickets Created/ Search Ratio as a % |
|---|---|---|---|---|---|
| P1 – P6 2024 | 437,422 | +13,683 | 1.15% | 0.60% | 10.78% |
| P1 – P6 2023 | 350,481 | +12,656 | 0.81% | 0.47% | 12.03% |
| % Difference | +24.8% | +8.11% | +42.0% | +27.7% | -10.4% |
Template for the monthly Customer Care Center KPI report